In August 2020, the Department for Business, Energy & Industrial Strategy released their electricity generation costs calculations for 2020 (report completed in January 2020. This is the first time the BEIS has released cost analysis since their last report in 2016. The report consults external providers’ analyses on:
Cost assumptions for different energy generation technologies (2018)
Costs and technical assumptions for gas plants with carbon capture, usage and storage (2018)
Costs and assumptions for Bioenergy with Carbon Capture and Storage (2019)
Key assumptions for offshore wind, onshore wind and solar photovoltaics (2018-19)
New evidence on small scale solar PV (2019)
Small changes to assumptions for combined cycle gas turbines, anaerobic digestion and tidal stream (2017-2019)
The majority of costs reported are presented as levelized costs, which is a measure of the average cost per MWh generated over the full lifetime of a plant. The levelized cost is calculated by dividing the net present value (NPV) of total costs by NPV of electricity generation.

Through these analyses the report estimates how the cost of solar and wind production will further decline into 2040, because of manufacturing improvements and increasing wind turbine load factors. The graphs and tables below have been snipped from the report and included in this write-up for your convenience.


For comparison, simply looking at the “central” figures the projected cost declines for offshore wind, onshore wind, and solar heading into 2040 is 30%, 4.3%, and 25%, respectively. The projections suggest that the levelized cost of electricity in 2040 produced by wind and solar will be about ½ the cost of the most efficient gas turbine carbon capture processes.
Wind
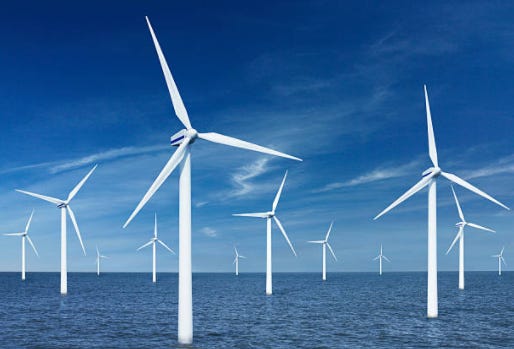
The load factor is the expected annual power generation as a percentage of theoretical maximum power generation. For wind turbines this is expected to increase/improve with increasing turbine size as shown in the table below.

The below chart is from Wind and Solar Cheaper - Evans and shows how costs have decreased from 2013 to 2020. Offshore, onshore, and solar have declined by ~57%, ~55%, and ~53%, respectively.

As turbines get larger these will be implemented offshore to improve load factor and efficiency. There are limitations on wind turbine size on land, which explains the improved efficiency offshore.
Solar
Solar efficiency will not improve by simply getting “bigger” like that of wind turbines. Cost reductions will come from improved manufacturing and raw material price declines.
Takeaways
The load factor of different forms of energy generation are critical in determining the cost and implementation. According to a Statista report the load factor of electricity from solar photovoltaics in the United Kingdom is 11.2%. Solar is impacted by a variety of factors, so this value should not be taken as absolute. As stated above, the load factor of wind turbines in 2020 is about 47%.
Finally, the average load factor for world’s coal fired power stations is around 51%, while natural gas is around 55%.
So what?
On first glance, one would think that coal or gas is more economical, but wind and solar efficiencies are continuing to improve. Global initiatives are funding further research and development to build a sustainable future, and it may surprise you that the costs of these technologies are getting closer and closer to coal/gas.
In a two part series I will breakdown the costs and developments of solar and wind technologies. Stay tuned for more!


