Breaking Down Wind Power Costs and Future Outlook
Capacity factor is driving the move to offshore.
The Power of Wind
Solar energy harvested from the sun’s rays is not the only type of energy it provides Earth. The sun is actually the source of wind energy as well. This may not make intuitive sense, but as the Earth orbits the sun and rotates on its axis different hemispheres are exposed to light. The light heats and cools the Earth, which causes areas of high and low air pressure. The air, or wind, you feel is the flow of air from high to low pressure areas. As you can imagine other factors such as weather patterns, ocean currents, and the human population can all impact air pressure. The constant fluctuation of pressures causes winds to vary throughout the world, and therefore causes engineers to carefully plan the construction of wind turbines.
In the 19th century, the first wind turbine was invented to harvest the wind’s kinetic energy. That kinetic energy is converted into mechanical energy by turning an internal shaft connected to a gearbox. The gearbox speeds up the rotation to an appropriate level to spin a generator. The AC or DC generator produces electricity which is then sent to wires and tied into the power grid.

The world has come a long way since the original wind turbine which had wooden rotors spanning 50 feet in diameter. Over the past century there have been significant improvements in efficiencies that are driving increased adoption for renewable energy generation.

Costs of Wind Power
The costs of wind power are becoming more and more attractive. In fact, the cost from 2013 has dropped by over 75% to <.02c per kWh in 2019. As shown in the analysis of the 2020 BEIS report, the cost of onshore and offshore wind is already cheaper than natural gas power production on a levelized cost basis. The chart below clearly shows that in the early 2000s there was a realization that wind power was a viable solution, and it has experienced exponential growth ever since. Manufacturing and scale efficiencies will continue to put downward pressure on production costs.

Factors that Contribute to Wind Cost
Understanding where wind blows the fastest or the most consistently is desirable for maximizing efficiency of wind turbines. Betz’s law states the maximum energy, 16/27 (59.3%), that can be extracted from wind. Today’s utility scale wind turbines at peak can only achieve 75-80% of the Betz limit (~44-47% efficiency).

Maximum theoretical power is determined by multiplying the Betz coefficient by air density, wind velocity, and effective area of the disk created by rotation.
But ultimately, the load or capacity factor is critical for determining the cost of electricity production from wind turbines. The capacity factor is determined by dividing the actual electricity output by the maximum possible output. In general the larger the turbine, the higher the efficiency. As you can see in the table below, the capacity factor has increased over time.

This annual data from the United States shows continual improvements, but is not entirely representative of the capacity factor improvements for new builds. Average capacity factor for projects built between 2014 and 2017 was 41.9%. The overall installed capacity factor will only modestly improve over time because of older technologies currently in operation.
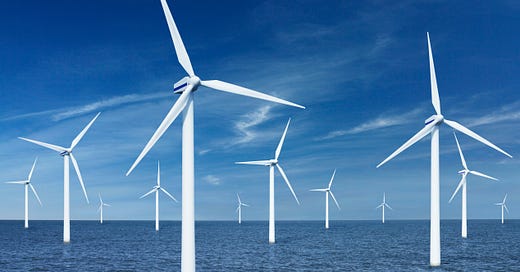
Onshore wind turbines are limited in size, so there is a strong push for offshore turbines to increase capacity factor and efficiency. Offshore wind farms are planned for completion in the United States around 2023-2024, while there are already 18,000 MW of installed capacity in 17 markets around the world. The latest offshore wind turbine from Siemens is rated for a higher power generation than the highest rated onshore turbine from Vestas.

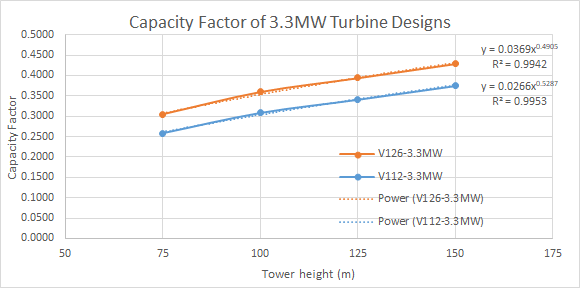
Although the capacity factors are unknown we can speculate that they will continue to increase. I pulled data from a research report that obtained capacity factor values from various Vestas wind turbines models in Finland. The controlled study analyzed turbines of different rotor length and tower height. In the scatterplots below it is clear that:
As tower height increases capacity factor (efficiency) improves. This is mainly attributed to higher wind speeds at higher elevations.
For turbines with equal power output, increased rotor length improves capacity factor. Larger blades can capture more wind, and therefore generate more torque to power the generator.


Future Outlook and Predictions
Wind turbine installations have begun ramping up in the United States. We are admittedly behind the curve, as offshore installations in the US will not be completed for a few years.

The industry will continue to seek ways to improve efficiencies to further drive down the cost of electricity generation. Turbine rotor length and installation location are two of the most important factors in driving further cost efficiencies. The GE Haliade-X 12MW and Siemens 14MW (247m height) offshore wind farms will have blades in excess of 100m. If you extrapolate out the graphic below one would expect the Siemens SG14-222 to be submerged about 40m underwater and protrude over 200m above the surface.

As wind power wins more contracts experts will need to be strategic where they build farms. Maximizing output requires a holistic understanding of air density, wind velocity, and blade engineering/design. Based on the global wind map below we can speculate that wind farms on land in the United States will primarily be built in the midwest and northeast. Offshore will be most prevalent around the coasts of Georgia, North Carolina, South Carolina, California, Oregon, and Washington.

Wind power’s share of total electricity generation in the US is continuing to increase. At about 7.3% of total generation in 2019, we can expect this to reach the double digits in the next five years.

Useful Resources
1) Betz's Law Proof and Explanation YouTube video
2) 2019 Global Wind Energy Council Report. https://gwec.net/wp-content/uploads/2020/08/Annual-Wind-Report_2019_digital_final_2r.pdf
3) BEIS 2020 Report https://www.gov.uk/government/publications/beis-electricity-generation-costs-2020


